GPT Image 2 for Scientific Figures: Prompt Design & Editable Workflow Guide
Introduction
Stop simply copying your paper abstract into AI image generators — that is where most people go wrong when creating scientific figures with AI. For researchers, a scientific figure is not merely an illustration. It is an essential part of the storytelling process of a paper.
A well-designed figure performs a form of information compression: within a limited visual space, it helps readers quickly understand: what problem the study addresses; what methodology is proposed; where the key innovation lies; why the proposed approach works.
The core workflow should be: Paper Understanding → Figure Type Selection → Information Abstraction → Visual Encoding
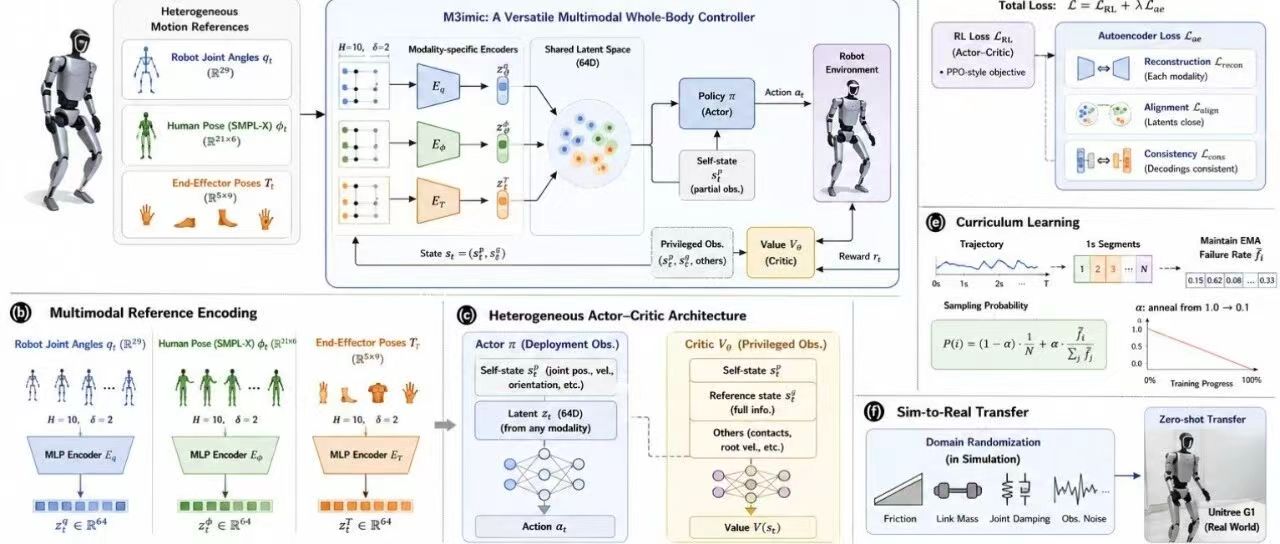
Figure 1: AI-Powered Scientific Figure Generation Pipeline
Our Approach: Making AI Understand Research Logic
A better approach is to explicitly instruct the model to analyze: the research problem; the technical pipeline; the core contributions; the experimental validation logic; the relationship between different components. The process: Paper Content → Research Logic Analysis → Visual Design → Scientific Figure Generation
Scientific Figure Types Should Match Research Paradigms
| Research Paradigm | Figure Type | Visual Focus |
|---|---|---|
| Theoretical proposal | Conceptual framework | New concepts, hypotheses |
| Algorithm design | Method overview, pipeline | Problem, solution strategy |
| Deep learning architecture | Network architecture | Components, info flow |
| Component improvement | Module zoom-in, comparison | Structural changes |
| Reasoning mechanism | Information flow, causal graph | Internal processing |
| Dataset engineering | Data lifecycle pipeline | Collection, processing |
| Benchmark/evaluation | Evaluation framework | Tasks, metrics, protocols |
| LLMs/multimodal | Multimodal framework | Data fusion, knowledge |
| Agents/embodied AI | Closed-loop workflow | Perception, action, feedback |
| Cross-disciplinary AI | Domain-AI framework | Domain knowledge, validation |
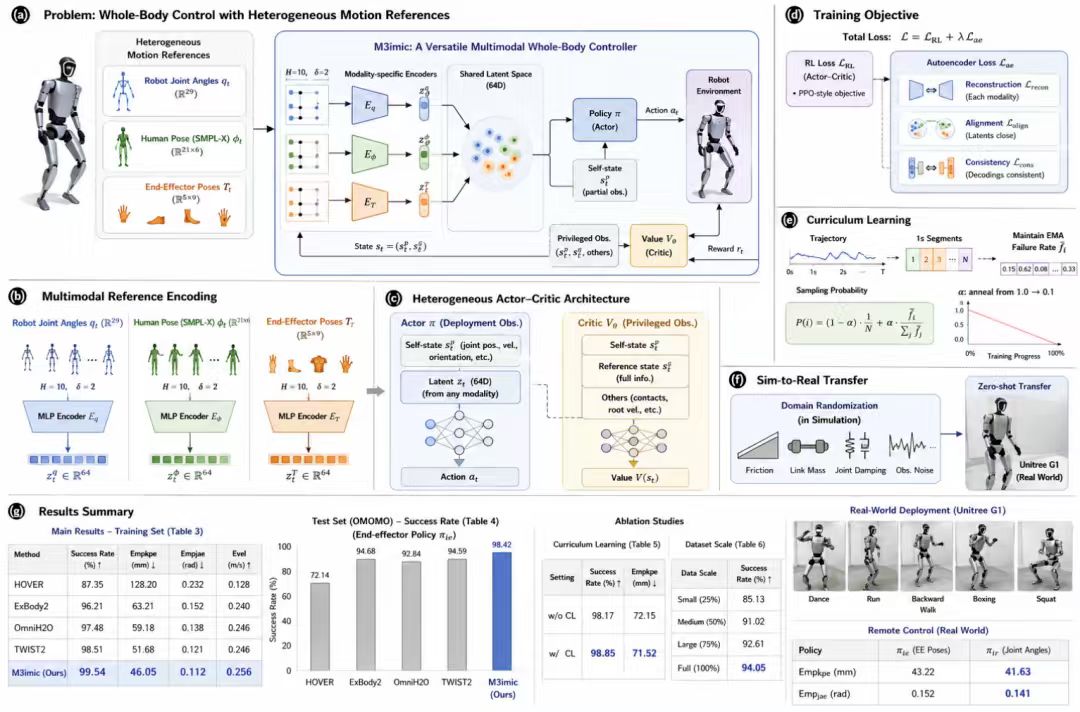
Figure 2: Research Paradigm to Figure Type Mapping
Visual Style: Nature, Science, IEEE Standards
Clean 2D vector style; White background; Minimal noise; Limited color palette; Colors only for functional grouping. Output should resemble Method Overview figures, Framework diagrams — not PowerPoint slides or marketing graphics.
Visual Hierarchy Matters
Highest priority: Core innovation, proposed method. Second: Overall workflow, data relationships. Supporting: Input data, experiments, results.
Complete Prompt Template
You are a professional scientific visualization designer with expertise in CS, AI, engineering systems, and data science. Design publication-quality figures following Nature/Science/IEEE standards.

Analyze: research background; scientific question; research paradigm; technical methodology; data flow; experimental validation; main contributions.

The figure should communicate: What problem is addressed; What method is proposed; Why the method works; What value it provides.

Select figure structure based on research type. Apply strict visual hierarchy. Use clean 2D vector style, white background, limited palette. Colors only for functional grouping.
Making AI Figures Editable (SVG Workflow)
Simply ask: "Convert this scientific figure into SVG code. Keep every module, label, arrow, and icon as an independently editable element." Then refine in Adobe Illustrator, Figma, or Inkscape.
Recommended Paper Submission Workflow
GPT Image 2 → Initial Design → SVG Conversion → Illustrator/Figma Refinement → Publication-Ready Figure