ChatGPT Image 2 Scientific Figure Prompt Template Library: Mechanism Diagrams, Workflows, Reviews, Covers, and More
Introduction
Hey everyone, this is SiliconTide.
Many people use ChatGPT Image 2 for scientific figures, but the images look pretty yet unlike paper figures. The problem is usually not the model but the prompt: you only describe the research background without specifying the figure type, mechanism chain, layout, and visual constraints.
This article organizes 15 sets of ChatGPT Image 2 prompts by the most common scientific figure scenarios. Each set includes applicable scenarios, a ready-to-modify prompt, substitution suggestions, and a sample image.
Remember this order: first choose the figure type, then write the mechanism chain, and finally add layout and constraints.
01 Graphical Abstract
Pain point: Your paper needs an overview figure, but elements just become a collage when stuffed in.
Best for: Paper graphical abstracts, project report first pages, grant proposal research overview.
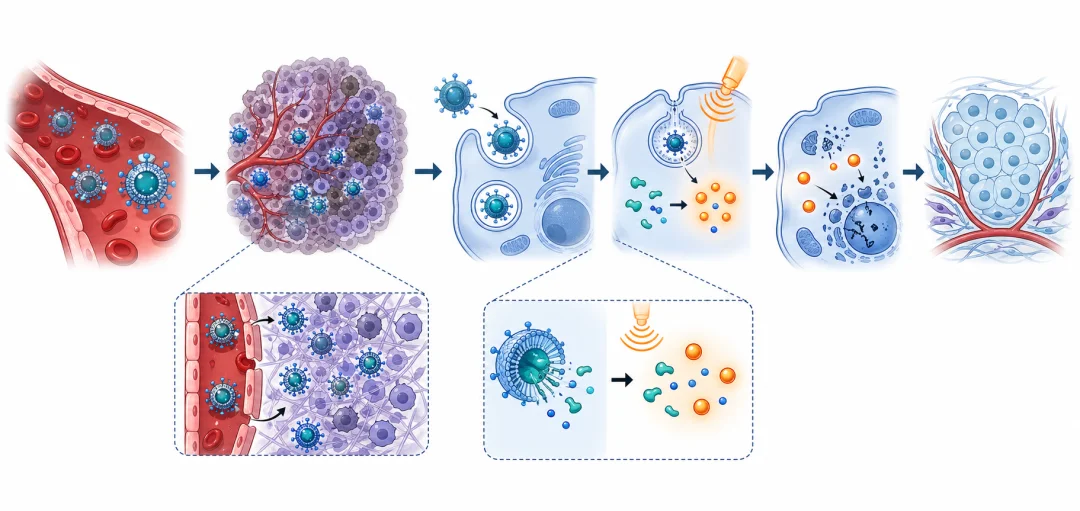
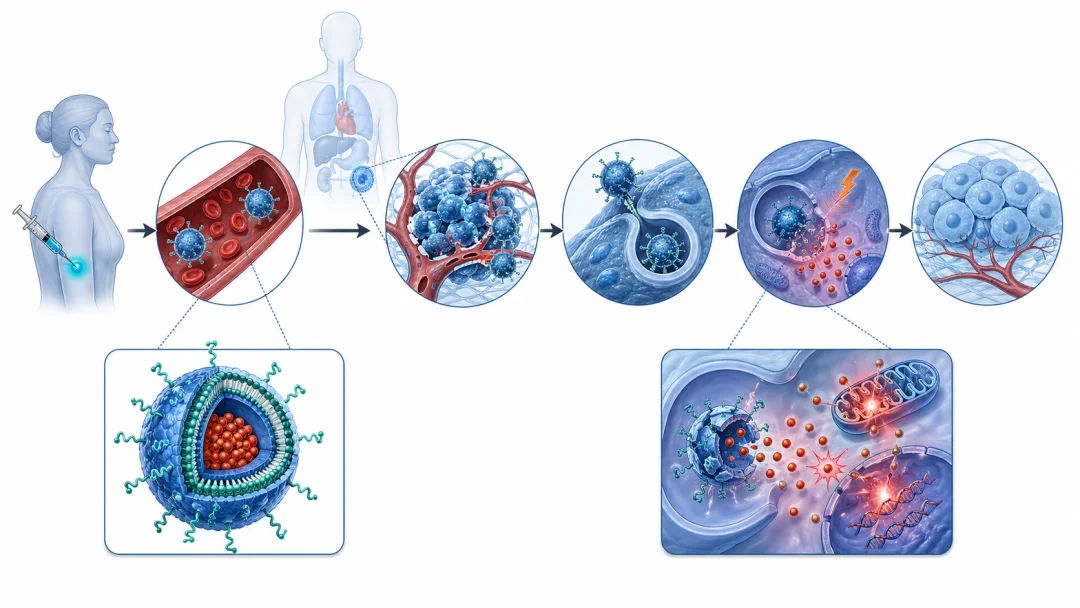
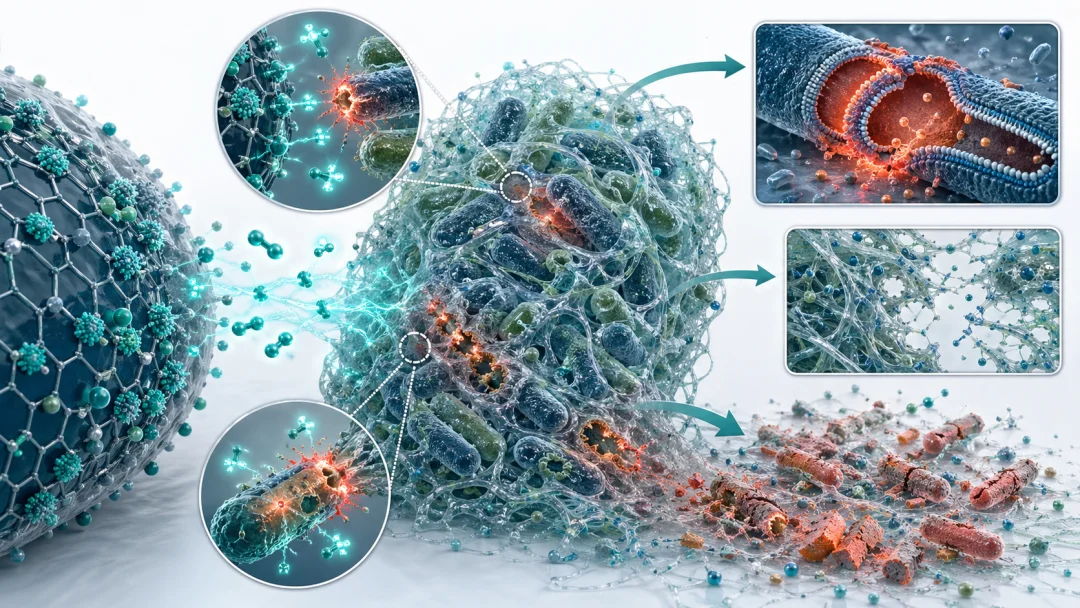
Create a publication-ready scientific graphical abstract for ChatGPT Image2. Topic: a new therapeutic strategy that converts an inactive prodrug into an active treatment inside diseased tissue. Show the complete story in one clean left-to-right visual chain: systemic delivery, target-tissue accumulation, cellular entry, local activation, therapeutic action, and final improvement. White background, clear arrows, two zoom-in windows, tidy journal-style vector schematic. Blue and teal palette with warm orange only for activation. Avoid dense text, decorative clutter, fake labels, photorealistic people, and poster-like effects.Substitution tip: Replace the research subject, key processes, and final outcome with your own topic.
Tip: Draw the "storyline" first, then details. Readers need to understand what happened before caring about aesthetics.
02 Experimental Workflow / Method Roadmap
Pain point: Many experimental steps, but after three minutes at group meeting, nobody knows what you did first.
Best for: Methods figures, project roadmaps, proposal defense, horizontal workflow overview.
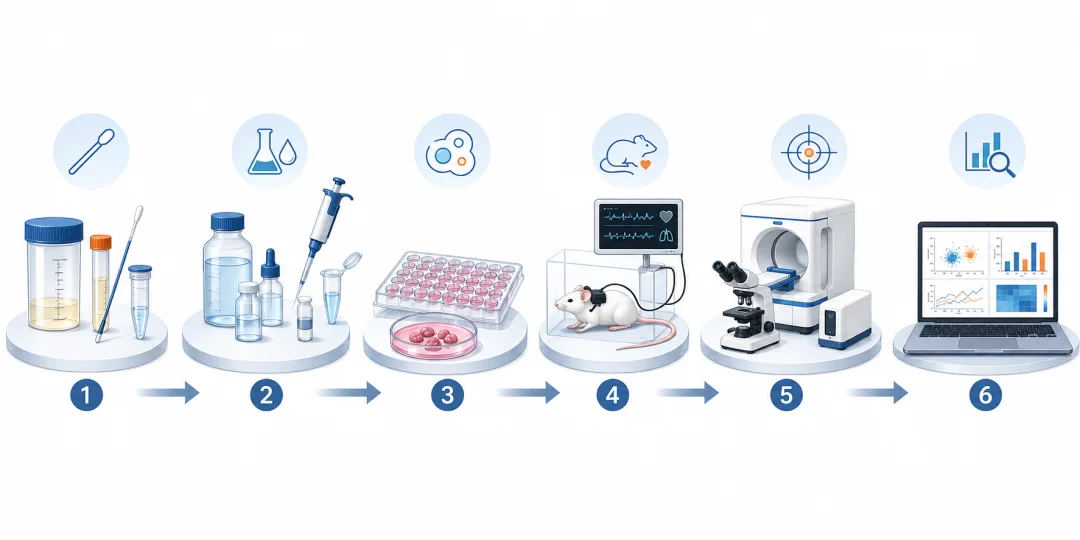
Create a clean scientific method workflow illustration for ChatGPT Image2. Show a complete research pipeline from left to right with six clearly separated stages: sample collection, material preparation, in vitro validation, system-level testing, imaging/measurement, and data analysis. Each stage represented by a simple mini-scene or icon-like scientific object, connected by arrows in a single horizontal flow. White background, blue-gray palette, small orange accents for key checkpoints.Substitution tip: Replace the 6 stages with your actual experimental steps; keep only one most identifiable visual object per step.
03 Core Mechanism Schematic
Pain point: Mechanism diagrams aren't about piling molecules, cells, and arrows together — they need causal relationships visible at a glance.
Best for: Signaling pathways, drug action mechanisms, regulatory networks, causal chain explanations.
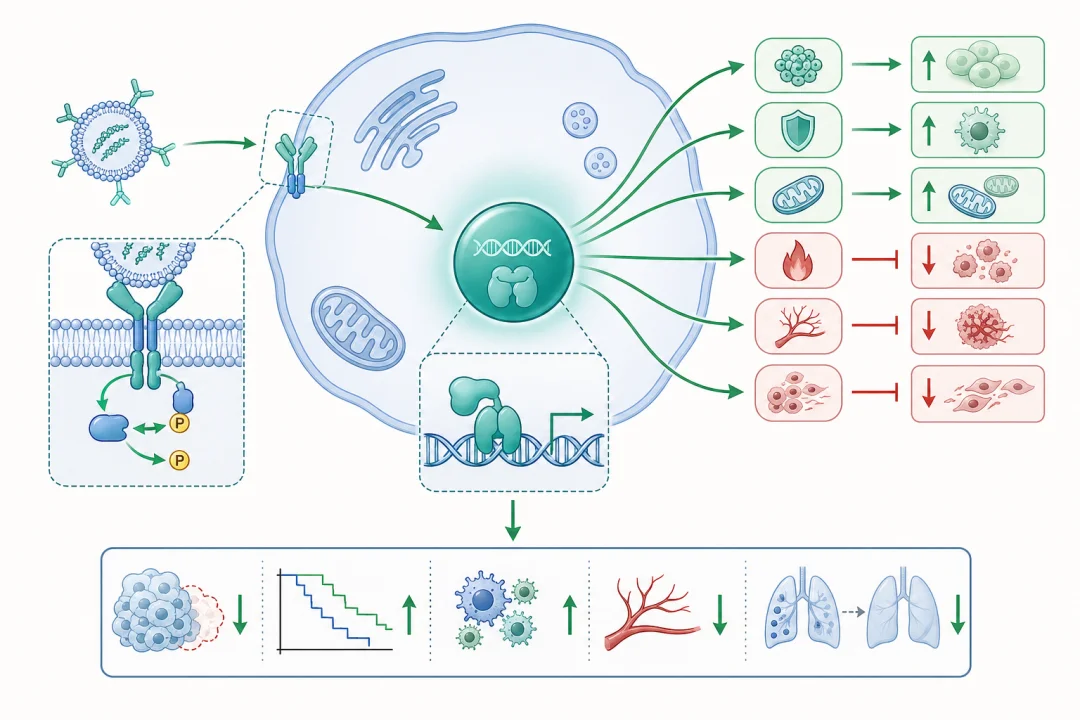
Create a publication-ready scientific mechanism schematic for ChatGPT Image2. Show how an external intervention changes a central biological pathway and produces a measurable phenotype. Center-focused layout: main cell/system in the middle, upstream trigger on the left, key regulatory node in center, downstream events on the right, final outcome at bottom. Arrows for activation, blunt-end symbols for inhibition, two zoom-in windows for molecular details. Pale background, blue-green main colors, red accents only for inhibited processes.04 Intracellular Mechanism
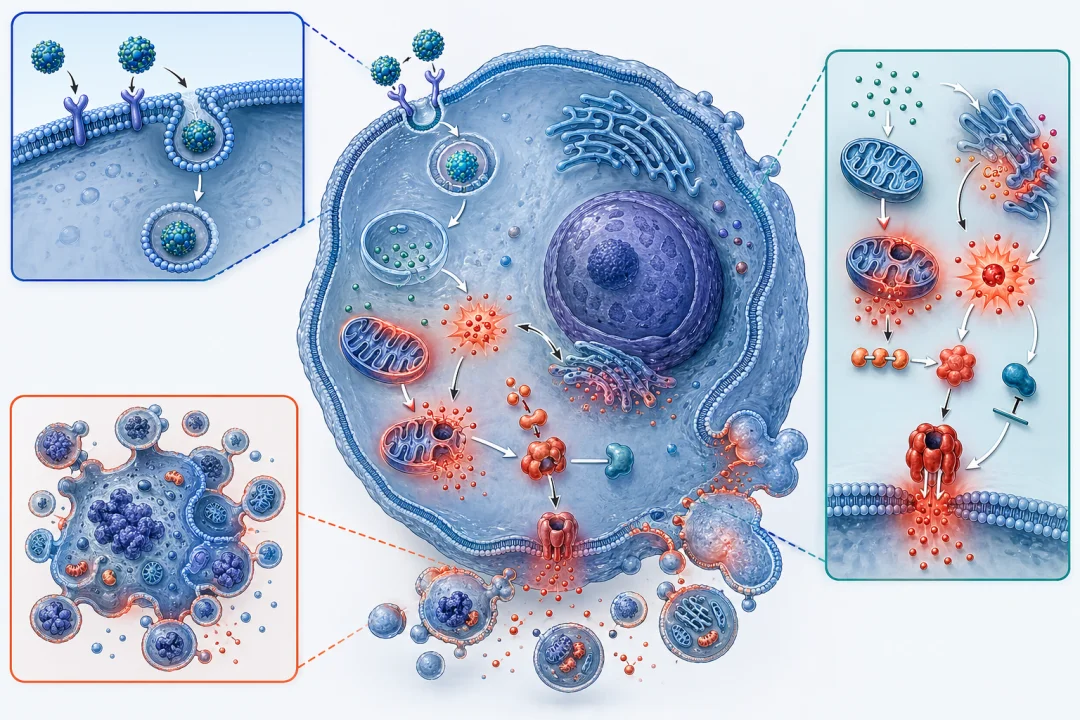
Pain point: With mitochondria, lysosomes, nucleus, ROS, and apoptosis all in one figure, it gets messy fast.
Best for: Subcellular localization, cell death, drug release, organelle damage.
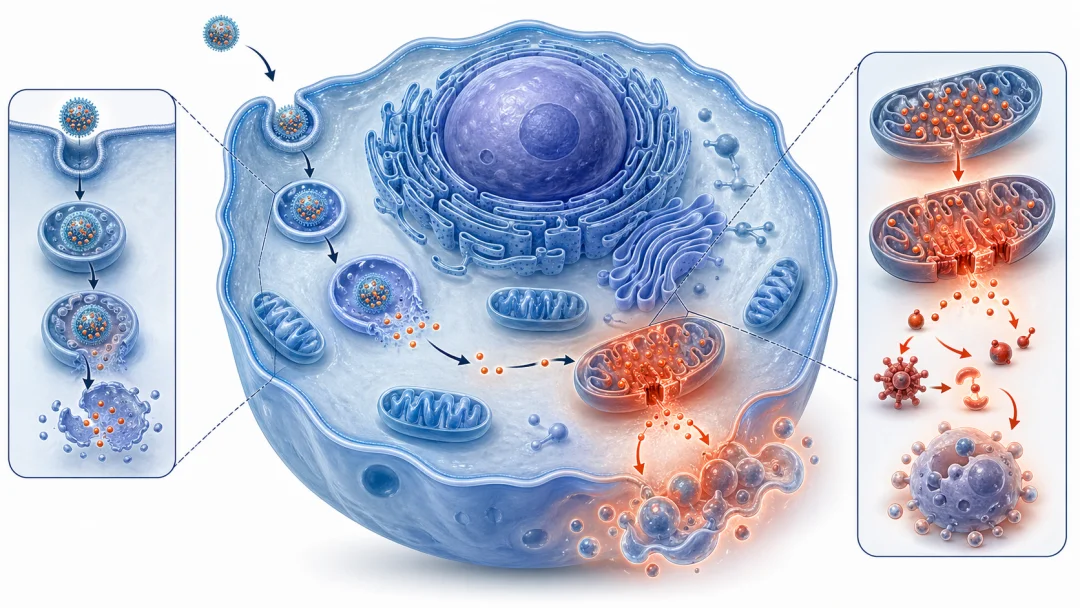
Create a biomedical intracellular mechanism illustration for ChatGPT Image2. Show a therapeutic agent entering a diseased cell, escaping vesicles, locating to a specific organelle, triggering stress, and causing cellular response. Large central cell cutaway with visible organelles, two magnified detail windows. Clean vector-like biomedical rendering. Blue and cyan structures, orange-red highlights for stress signals.05 Tumor Immune Microenvironment
Pain point: Immune cell relationships are complex — writing "enhance immunity" rarely generates reliable figures.
Best for: Tumor immunology, inflammatory microenvironment, immunomodulatory materials, cell-cell interactions.
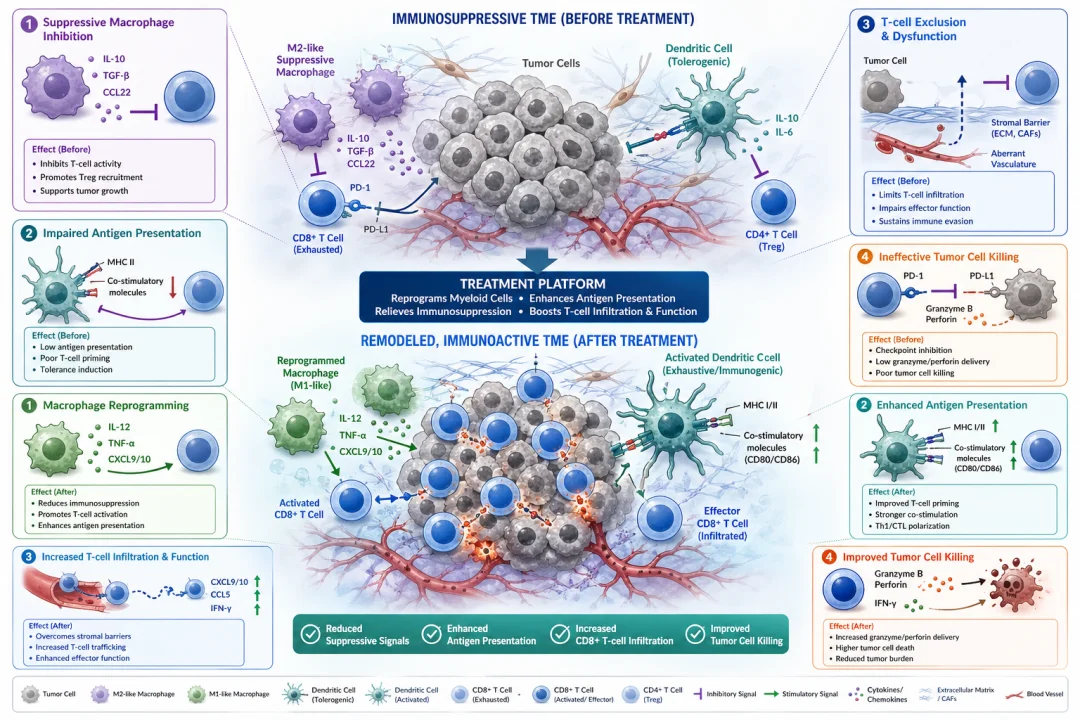
Create a scientific tumor immune microenvironment schematic for ChatGPT Image2. Place tumor tissue in center, show multiple immune-cell interactions around it. Illustrate treatment remodeling the microenvironment by reducing suppressive macrophages, activating antigen presentation, increasing cytotoxic T-cell infiltration, and improving tumor killing. Clean biomedical illustration, bright background, blue-green base, orange-red highlights for immune activation.06 Drug Delivery / Nanocarrier Graphical Abstract
Pain point: The most common failure in nanomedicine figures: the carrier looks beautiful but the therapeutic pathway is broken.
Best for: Nanomedicine, targeted delivery, responsive release, combination therapy.
Create a publication-ready drug delivery graphical abstract for ChatGPT Image2. Show a smart nanocarrier carrying therapeutic cargo through the body, accumulating at target lesion, entering cells, responding to local trigger, releasing cargo, producing therapeutic outcome. Clear left-to-right pathway with zoom-in views. Blue and teal palette, red-orange only for release effects.07 Nucleic Acid Delivery / Gene Editing
Pain point: siRNA, mRNA, CRISPR figures can't just show "it arrived" — the real challenge is intracellular trafficking.
Best for: LNP, AAV, siRNA, mRNA, CRISPR, gene silencing or expression.
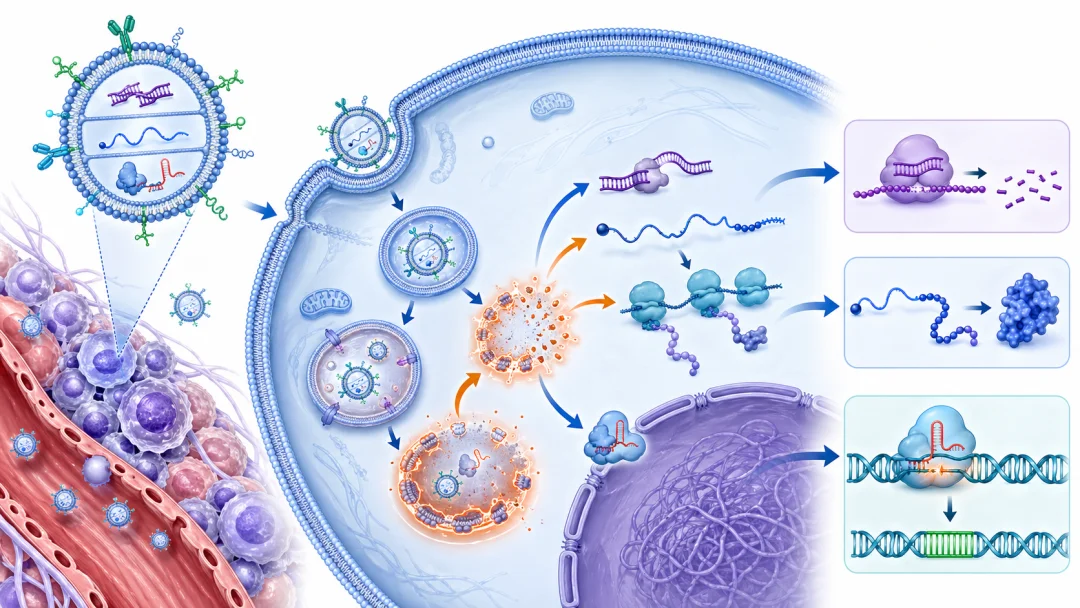
Create a scientific nucleic-acid delivery graphical abstract for ChatGPT Image2. Show delivery vehicle carrying siRNA, mRNA, or CRISPR components to target tissue, entering cells by endocytosis, escaping endosomes, releasing nucleic acids, and producing gene regulation. Left-to-right layout with large cellular zoom-in. Blue-green palette, orange highlights for nucleic-acid release.08 Programmed Cell Death Mechanism
Pain point: Apoptosis, pyroptosis, ferroptosis, autophagy involve many events — without layering, it becomes a muddled oxidative stress hodgepodge.
Best for: Ferroptosis, pyroptosis, apoptosis, autophagy, necroptosis papers.
Create a publication-ready programmed cell death mechanism schematic for ChatGPT Image2. Focus on treatment-induced cell death pathway. Show trigger, molecular events, organelle damage, and final phenotype. Structured layout with cell as main scene and three zoom-in panels: upstream trigger, molecular cascade, morphological outcome. Blue-green structures, orange-red accents for damage.09 Antibacterial / Biofilm Clearance Mechanism
Pain point: Antibacterial figures shouldn't just show material touching bacteria — show membrane disruption, ROS generation, or biofilm clearance.
Create a scientific antibacterial mechanism illustration for ChatGPT Image2. Show antimicrobial material interacting with bacteria and biofilm: membrane disruption, reactive species generation, biofilm matrix loosening, bacterial death. Center-focused with zoom-in panels. Clean professional biomedical schematic style.10 Materials Chemistry / Catalysis Mechanism
Pain point: The key isn't "cool-looking materials" but whether interfaces, electrons, holes, and reaction paths are understandable.
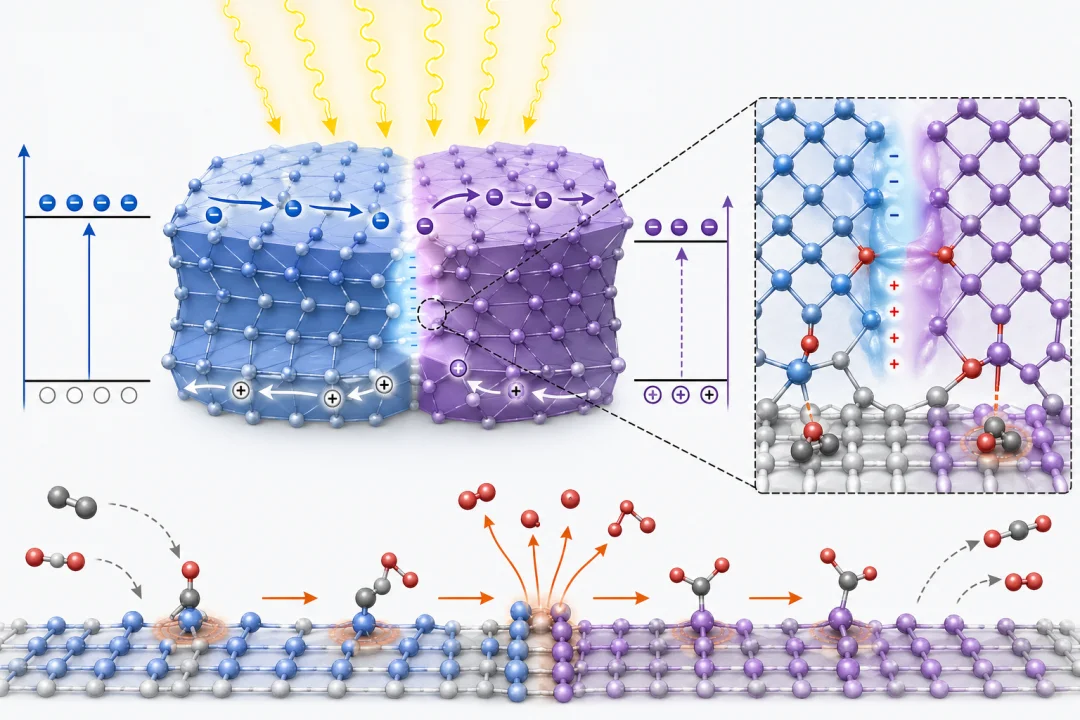
Create a scientific materials-chemistry mechanism schematic for ChatGPT Image2. Show heterostructured catalyst with connected material phases forming active interface. Energy input, charge separation, electron/hole migration, reactive species generation, reactant-to-product conversion. Layered composition with zoom-in for atomic details. Blue-purple material bodies, yellow energy input, orange-red reaction highlights.11 Energy Device / Battery Interface Mechanism
Pain point: Battery, catalysis, and electrode figures often fail at "not showing the interface process."
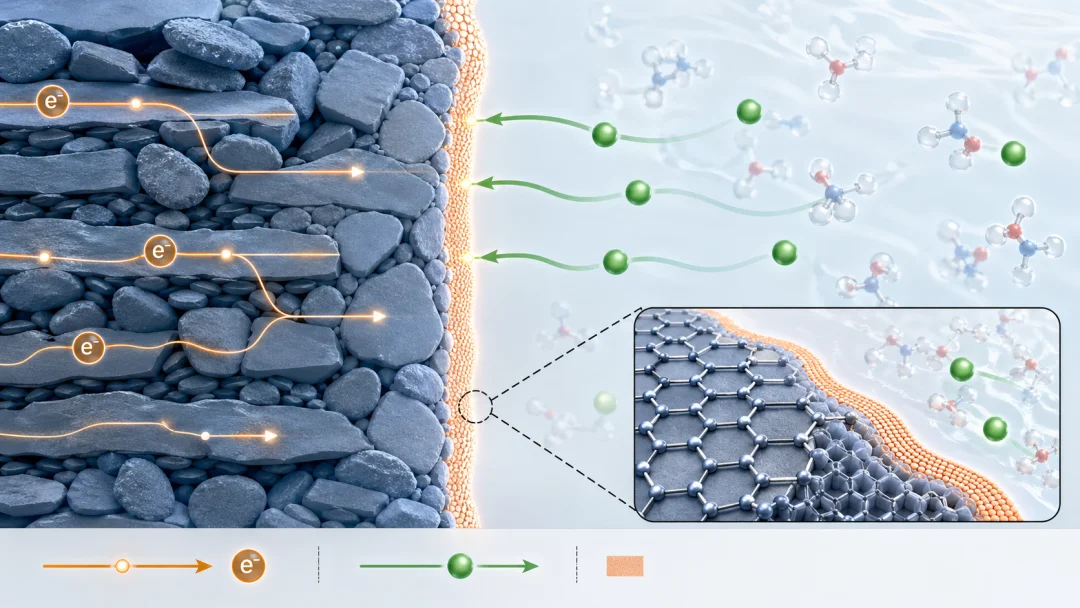
Create a publication-ready energy-device interface schematic for ChatGPT Image2. Show electrode-electrolyte interface in rechargeable battery. Cross-sectional layout with directional ion movement. Small zoom-in for nanoscale surface structure. Blue-gray materials, green ions, orange highlights for improved pathways.12 Multi-Omics / Single-Cell Integration
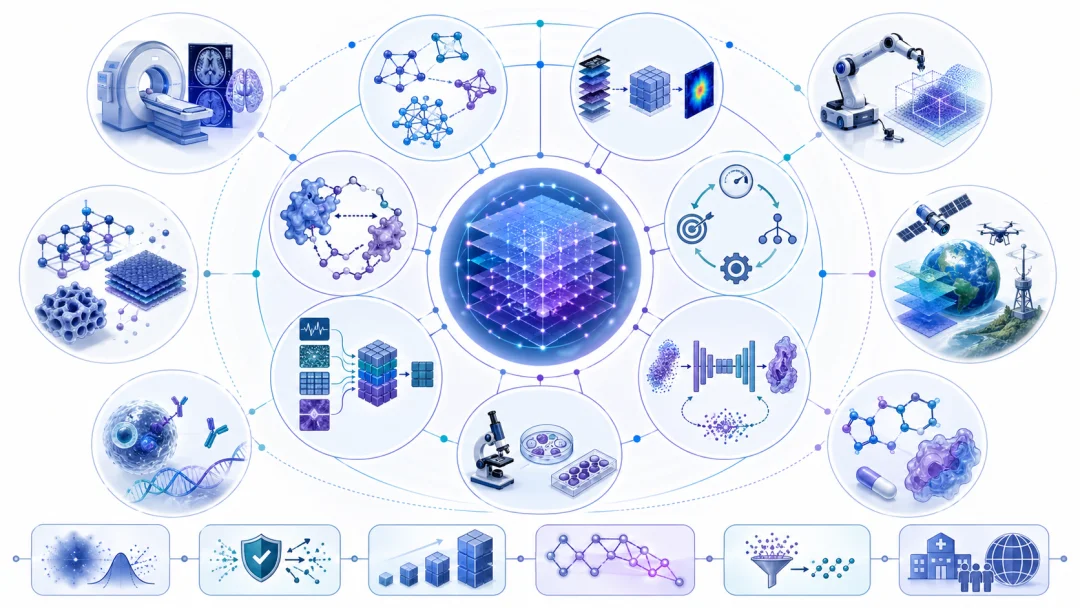
Pain point: Omics figures easily become database icon piles — what you really need to show is how data converges into mechanism.
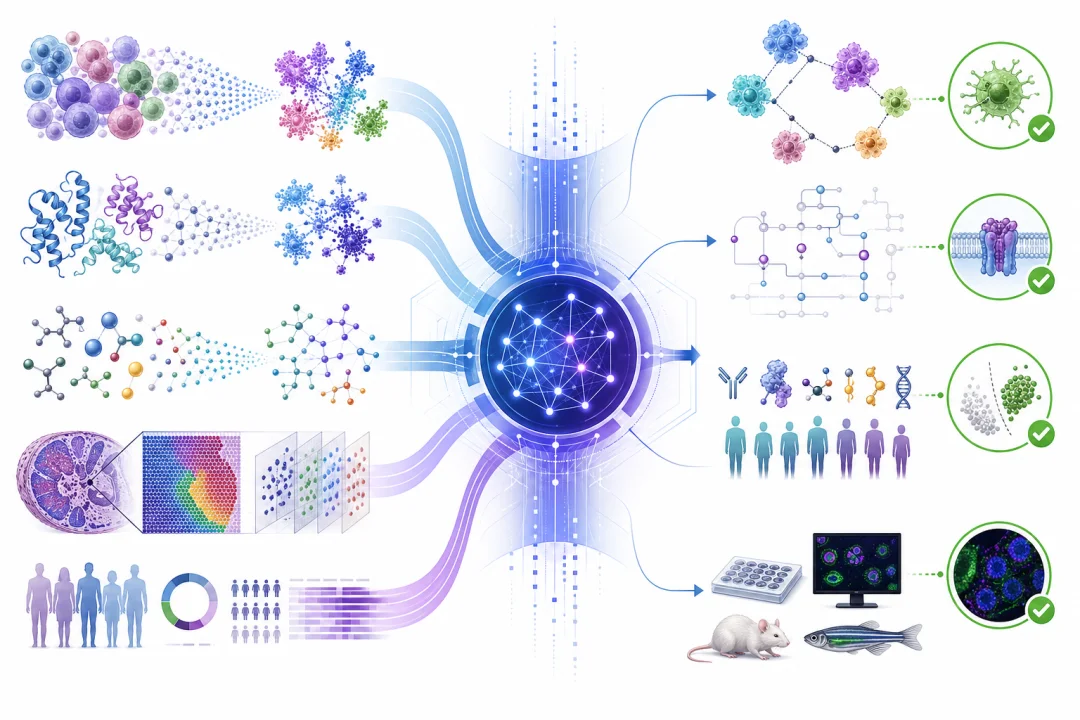
Create a scientific multi-omics integration workflow illustration for ChatGPT Image2. Show multiple data layers flowing into central computational integration, then discovery and validation. Funnel or hub-and-spoke layout. Modern clean scientific infographic, blue and violet palette, small green accents for validated findings.13 AI4Sci Workflow
Pain point: AI4Sci figures can't just show a brain and chips — show how the model enters the research loop.
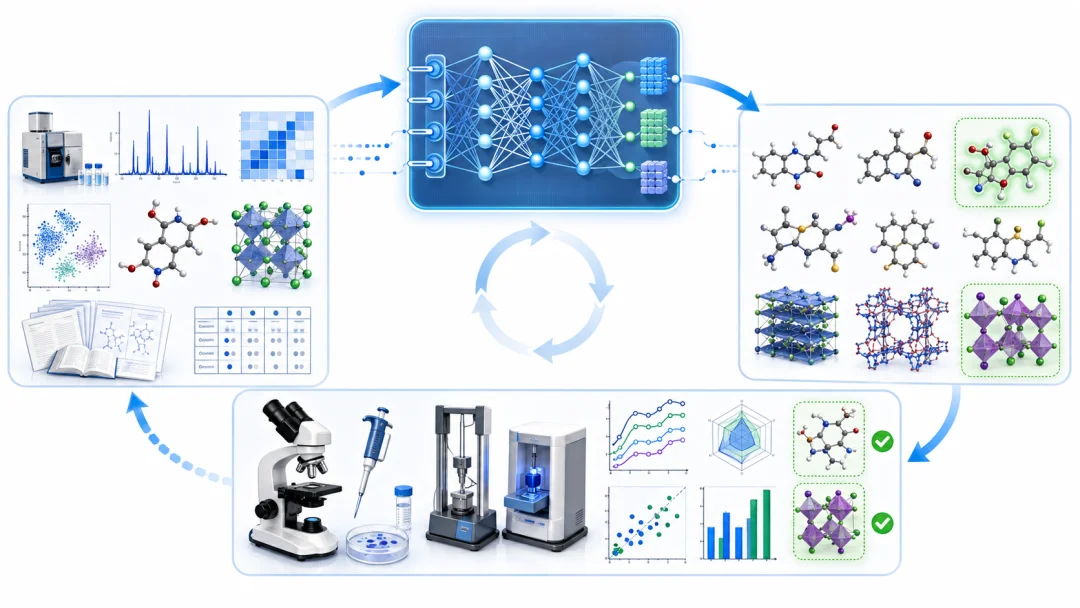
Create a clean AI4Sci research-loop illustration for ChatGPT Image2. Scientific discovery workflow: data → AI model → prediction → experiments → feedback. Circular closed-loop with four zones. Technology-blue palette, green highlights for validated candidates. No humanoid robots, no sci-fi clichés.14 Review Article Overview Map
Pain point: Review figures shouldn't cram all directions — give readers a field map.
Create a review-article overview map for ChatGPT Image2. Clean radial or layered map: central topic, major branches, application areas, future challenges. Calm professional palette of blue, teal, soft purple. Strong hierarchy, generous spacing.15 Journal Cover Style Scientific Figure
Pain point: Cover figures aren't mechanism figures made flashy — they need one hero visual with scientific explanatory power.
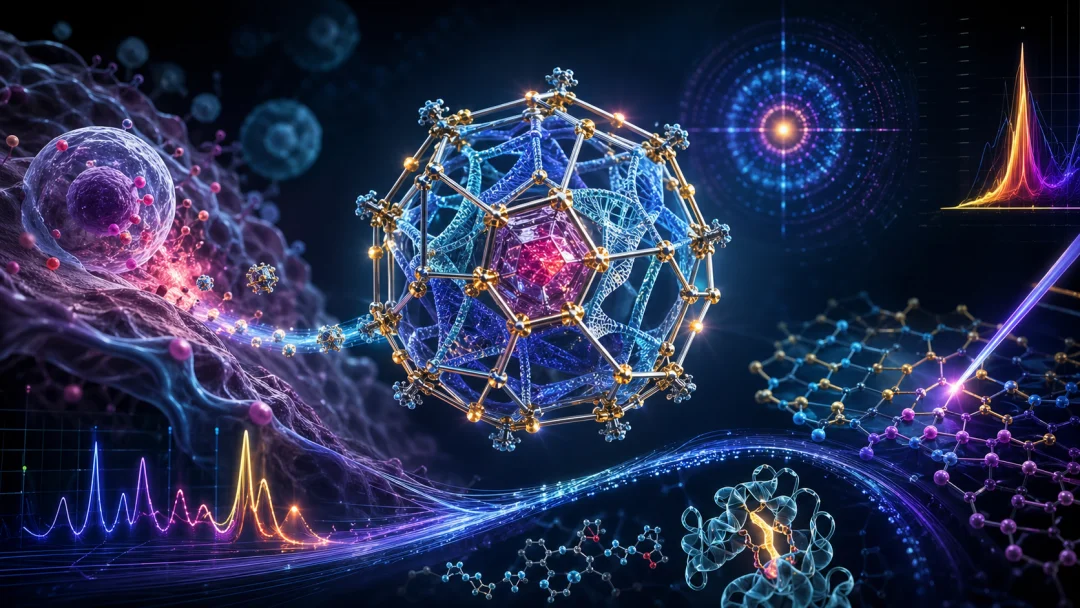
Create a high-impact journal-cover-style scientific illustration for ChatGPT Image2. One clear central hero object representing a breakthrough concept. Dramatic but plausible composition with premium lighting. Deep blue-black background with cyan, magenta, and gold highlights. Visually striking but academically credible.Universal Master Template
If you don't want to start from scratch each time, use this structure:
Create a publication-ready scientific [figure type] for ChatGPT Image2. Topic: [research topic]. Show [main object], [key process 1], [key process 2], and [final outcome]. Use a [layout type] composition with clear arrows, zoom-in views, or layered structure. Keep the figure clean, professional. Use [background], [primary color palette], and [accent color] only for key events. Avoid dense text, fake labels, irrelevant decoration, unclear arrows, and poster-like clutter.Tip: Chinese labels, formulas, and abbreviations are best added manually afterwards. Let ChatGPT Image 2 handle structure and visuals, then humans handle terminology accuracy.
References
1. Rougier N. P., et al. Ten Simple Rules for Better Figures. PLOS Computational Biology, 2014.
2. Cleveland W. S., McGill R. Graphical Perception. JASA, 1984.
3. Wong B. Points of View: Color coding. Nature Methods, 2010.
4. Wong B. Points of View: Visualizing biological data. Nature Methods, 2012.
Final note: Scientific figures aren't about making science more exciting — they're about making complex relationships easier to understand.